Autotask has two “types” of dashboards. The first are sharable and designed to be used as the primary launching point for techs, sales, procurement, service managers, etc. to work from. In addition to that primary dashboard method, there are “Account Dashboards” that work the same, but are ONLY viewable when you open an account in the CRM. So maybe think of them as “CRM Dashboards.”
Like the normal dashboards, you can customize Account Dashboards. Even better, you can create multiple dashboards viable in accounts in CRM. So you may want one for service desk, one for projects, one for billing, and so on.
Let’s walk through an example of building out a service desk dashboard for an Account Dashboard, including two widgets, one for a set of queues A and one for a set of queues B.
Start by going to (A)->Admin->Features & Settings->Accounts & Contacts->Account Dashboards
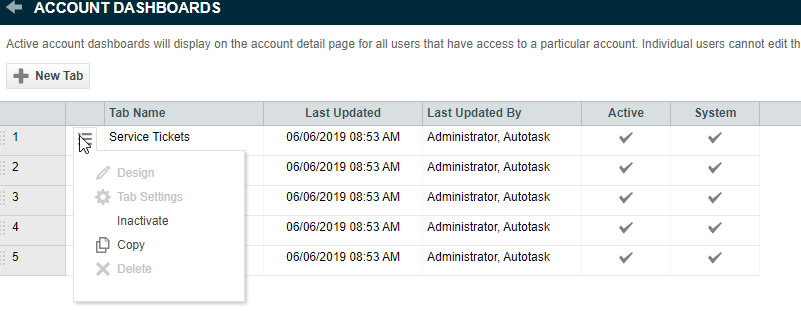
The first thing you’ll notice is that you CAN’T EDIT THE DASHBOARDS:

Bummer! But, good news. You can inactivate them and create new ones. For whatever reason, Autotask doesn’t want you editing their stock dashboards.
- Set the Service Tickets dashboard to Inactive
- Click Copy on the (now inactive) Service Tickets dashboard to clone it (make sure you set the Copy as Active as it is inactive by default because you are cloning an inactive dashboard)
- Click Save
- The new dashboard copy will open in the Designer
We now have a new dashboard we can customize for our Account view!
Let’s create two new widgets just to test things out. I’ll do the first one below, and you can do the second one.
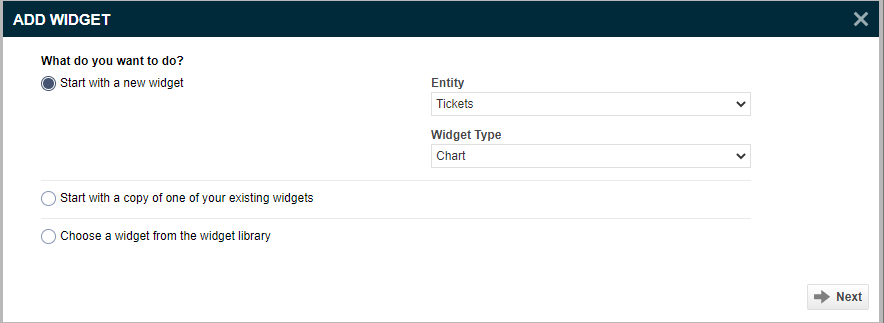
- Click an empty spot on the new dashboard, the “+ Add Widget” will appear, and click it
- Go with the Tickets/Charts widget
- Name it “Non-Alerts Tickets”
- Set “What do you want to report on” to “Count (of Tickets)”
- Set “Group Data” by “Queue”
- In Filters:
- Create the filter “Queue Not Equal To Monitoring Alert”
- Create the filter “Status Not In List Complete; Pending Close”
- Click Finish
I included screenshots below. Once this is done, you’ll see all tickets NOT in the Monitoring Alert queue. You can now clone the widget inside the dashboard and change to the filter “Queue Equal to Monitoring Alert” if you want a widget just for alerts.


Now, go to an account and view the Account Dashboards. You’ll notice your cloned dashboard is last in the list (this can be changed by moving the dashboards around in the Account Dashboards screen).
Share via: