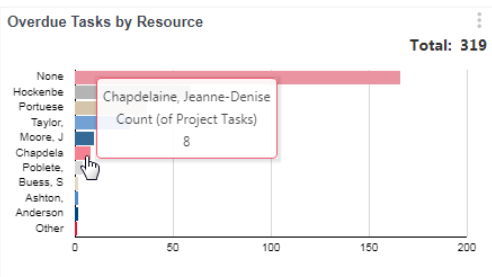
Widgets are graphical components on dashboards that visualize and summarize information about data in your Autotask interface. The charts, graphs, or gauges used to visualize data are similar to the concept of how they function in spreadsheet and reporting applications, such as Excel.

Users can interact with the graphical elements displayed on widgets. Clicking on, or drilling into, a graphical element or component on a widget opens a table grid that contains the underlying data records that represent a breakdown of what the widget is reporting on.
Note: You can display up to 24 data widgets on a dashboard tab.
Share via:
Tags: