When creating widgets in an Autotask dashboard, you need to decide the type of widget to use.
To determine the type of widget, ask yourself these questions:
- Am I looking for a trend?
- Am I looking for a trigger to activate an action by me?
- Do I need multiple variations of a KPI/trigger?
Those three questions will tell you pretty much everything you need to know.
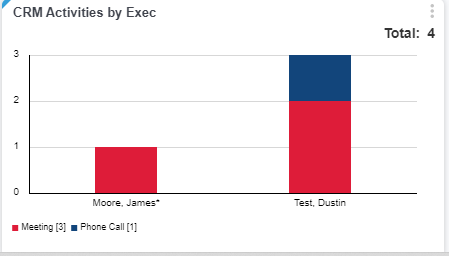
In reviewing these questions, I can say that the biggest mistake most people make is to go right to a graph widget. Graphs are ONLY good for trending. You should never use them as triggers. For triggers, use gauges.
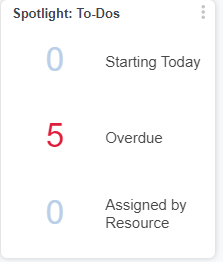
Gauges are great for triggers (i.e., X happens, you need to do Y). Better yet, when using gauges, you can create up to 6 gauges per widget, whereas a graph widget is restricted to a single data set. This comes in handy when you have several conflicting data sets that are related, e.g., if customer X does A, if customer X does B, if customer X does C but not D.
You can see two widget examples as screenshots below.
Graphs and Techs Don’t Mix
Consider this: Gauges are great for techs to trigger work, e.g., a gauge that shows new tickets assigned to them. However, while graphs are great for managers, they’re almost always a bad choice for tech dashboards! Your tech dashboards should generally be nothing but gauges. Why? Techs are action-oriented, and gauges trigger actions. Managers are both action-oriented and trend-focused.
Example Screenshots