As a Service Desk manager, you often want to better understand the utilization of your team. In Rocketship, we do that by always keeping every technical resource near “work capacity” automatically for you, but, still, there are other ways you may want to track that information, including for Autotask sites not using Rocketship. In this blog, I’ll walk you through setting up dashboard widgets to monitor utilization via billable hours.
First, let’s discuss lagging vs leading indicators (we’ll just say “KPI”). A leading KPI for technical resource utilization is “how much work is queued for this resource at any given time.” The lagging KPI is “how much work did the technical resource actually DO?” The problem with tracking utilization by “how many booked hours” is that you can’t do anything about it — it’s already in the past, and you are simply reporting on it. Be sure to pair a lagging KPI with a leading KPI so that you can get ahead of any problems.
Okay, on to the show! (By the way, I included a video on YouTube to help.)
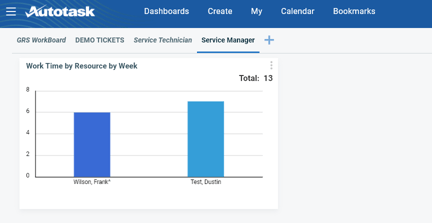
We are going to create a widget on our dashboard that compares Work Time across our technical team.
- Create a new dashboard and/or use your existing manager dashboard.
- Hover over a blank space on the dashboard and click “Add Widget” when it appears.
- Choose Entity “Work Entries” and Widget Type “Chart”.
- Label the widget “Work Time by Resource by Week”
- Data
- What do you want to report on: Worked Hours
- Group Data By: Resource
- Filters
- Filter 1: Work Date DYNAMIC RANGE “Today Minus 1 Weeks” to “NOW”
- Click Save & Close